Visualize the refined data with Excel

We will use Excel Professional Plus 2013 to access the refined sentiment data.

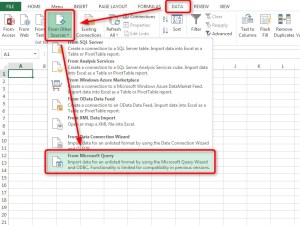
    • In Windows, open a new Excel workbook, then select Data > From Other Sources > From Microsoft Query.

26_open_query

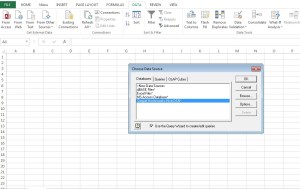
  • On the Choose Data Source pop-up, select the Hortonworks ODBC data source you installed previously, then click OK.The Hortonworks ODBC driver enables you to access Hortonworks data with Excel and other Business Intelligence (BI) applications that support ODBC.

27_choose_data_source

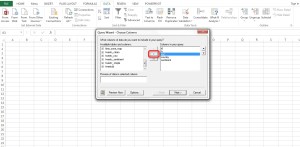
  • After the connection to the Sandbox is established, the Query Wizard appears. Select the “tweetsbi” table in the Available tables and columns box, then click the right arrow button to add the entire “tweetsbi” table to the query. Click Next to continue.

29_query_wizard2

  • Select the “text” column in the “Columns in your query” box, then click the left arrow button to remove the text column.
  • After the “text” column has been removed, click Next to continue.
  • On the Filter Data screen, click Next to continue without filtering the data.

31_query_wizard4

  • On the Sort Order screen, click Next to continue without setting a sort order.
  • Click Finish on the Query Wizard Finish screen to retrieve the query data from the Sandbox and import it into Excel.
  • On the Import Data dialog box, click OK to accept the default settings and import the data as a table.
  • The imported query data appears in the Excel workbook.

35_data_imported

Now that we have successfully imported the Twitter sentiment data into Microsoft Excel, we can use the Excel Power View feature to analyze and visualize the data.

In this section we will see how sentiment varies by country,

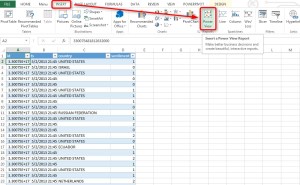
    • In the Excel worksheet with the imported “tweetsbi” table, select Insert > Power View to open a new Power View report.

36_open_powerview_tweetsbi

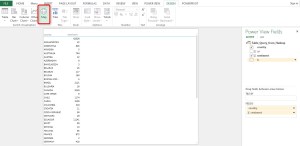
  • The Power View Fields area appears on the right side of the window, with the data table displayed on the left. Drag the handles or click the Pop Out icon to maximize the size of the data table.
  • In the Power View Fields area, clear the checkboxes next to the id and ts fields, then click Map on the Design tab in the top menu.

38_open_map

  • The map view displays a global view of the data.
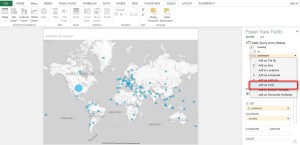
  • Now let’s display the sentiment data by color. In the Power View Fields area, click sentiment, then selectAdd as Color.

40_sentiment_add_as_color

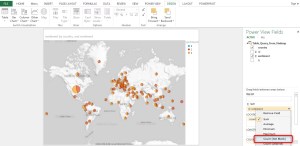
  • Under SIZE, click sentiment, then select Count (Not Blank).

41_sentiment_count_not_blank

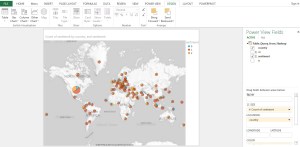
  • Now the map displays the sentiment data by color:
  • Orange: positive
  • Blue: negative
  • Red: neutral

42_sentiment_by_color

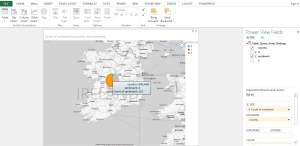
  • Use the map controls to zoom in on Ireland. About half of the tweets have a positive sentiment score, as indicated by the color orange.

43_ireland_sentiment

  • Next, use the map controls to zoom in on the sentiment data in China.

45_china_sentiment

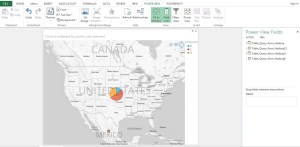
  • The United States is the biggest market, so let’s look at sentiment data there. The size of the United States pie chart indicates that a relatively large number of the total tweets come from the US.About half of the tweets in the US show neutral sentiment, with a relatively small amount of negative sentiment.
46_us_sentiment

Tools for data visualization

Creating infographics can be time-consuming. But these tools make it easier.

It’s often said that data is the new world currency, and the web is the exchange bureau through which it’s traded. As consumers, we’re positively swimming in data; it’s everywhere from labels on food packaging design to World Health Organisation reports. As a result, for the designer it’s becoming increasingly difficult to present data in a way that stands out from the mass of competing data streams.

One of the best ways to get your message across is to use a visualization to quickly draw attention to the key messages, and by presenting data visually it’s also possible to uncover surprising patterns and observations that wouldn’t be apparent from looking at stats alone.

1. Excel

excel

You can actually do some pretty complex things with Excel, from ‘heat maps’ of cells to scatter plots. As an entry-level tool, it can be a good way of quickly exploring data, or creating visualizations for internal use, but the limited default set of colours, lines and styles make it difficult to create graphics that would be usable in a professional publication or website. Nevertheless, as a means of rapidly communicating ideas, Excel should be part of your toolbox.

2. Tableau

desktop_overview_01_answer

Tableau Desktop is data analysis that keeps up with you. It’s easy to learn, easy to use, and 10-100x faster than existing solutions. It’s built on breakthrough technology that translates pictures of data into optimized database queries. Use your natural ability to see patterns, identify trends and discover visual insights in seconds. No wizards, no scripts.

3. R

R

How many other pieces of software have an entire search engine dedicated to them? A statistical package used to parse large data sets, R is a very complex tool, and one that takes a while to understand, but has a strong community and package library, with more and more being produced.

4. jpGraph

tool06

If you need to generate charts and graphs server-side, jpGraph offers a PHP-based solution with a wide range of chart types. It’s free for non-commercial use, and features extensive documentation. By rendering on the server, this is guaranteed to provide a consistent visual output, albeit at the expense of interactivity and accessibility.

Refining the Raw Data

    • In the Hortonworks Sandbox virtual machine (VM) console window, press the Alt and F5 keys, then log in to the Sandbox using the following user name and password:

Login: root\       Password: hadoop

After you log in, the command prompt will appear with the prefix [root@sandbox ~]#:

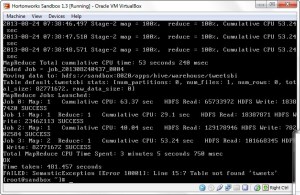
    • At the command prompt, type in the following command, then press the Enter key: hive -f hiveddl.sql

Lines of text appear as the script runs a series of MapReduce jobs. It will take a few minutes for the script to finish running. When the script has finished running, the time taken is displayed, and the normal command prompt appears.

22_hiveddl_sql_complete

The hiveddl.sql script has performed the following steps to refine the data:

  • Converted the raw Twitter data into a tabular format.
  • Used the dictionary file to score the sentiment of each Tweet by the number of positive words compared to the number of negative words, and then assigned a positive, negative, or neutral sentiment value to each Tweet.
  • Created a new table that includes the sentiment value for each Tweet.

We can look at the data using the Hive command line. We can start Hive by typing hive at the prompt.

23_start_hive (1)

Remember to add the json serde jar file so we can look at the tables.

23.1_add_jar

The command “show tables” will show you the tables. You can browse the data using the “select * from

limit 10;” command. The limit 10 gives you the first 10 records instead of the whole table.

24_show_tables

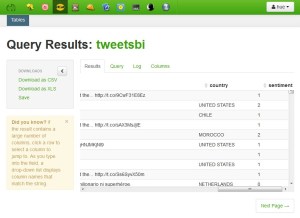
We can also use HCatalog to view the results,

25_tweetsbi_table

What is Sentiment Data ???

Sentiment data is unstructured data that represents opinions, emotions, and attitudes contained in sources such as social media posts, blogs, online product reviews, and customer support interactions.

3.5.2 Potential Uses of Sentiment Data

Organizations use sentiment analysis to understand how the public feels about something at a particular moment in time, and also to track how those opinions change over time.

An enterprise may analyze sentiment about:

  • A product – For example, does the target segment understand and appreciate messaging around a product launch? What products do visitors tend to buy together, and what are they most likely to buy in the future?
  • A service – For example, a hotel or restaurant can look into its locations with particularly strong or poor service.
  • Competitors – In what areas do people see our company as better than (or weaker than) our competition?
  • Reputation – What does the public really think about our company? Is our reputation positive or negative?

The benefits that this data offers are:

  • Improves Customer Service:
    It gives useful insights about current and future customers purchase preferences, brand affiliations, topics of interests, opinions, point of views on discussions, likes and dislikes in products/services and much more. This useful information lets organizations to drastically improve their customer service and engagement strategies by building on the positive sentiments and formulating methods to combat negative sentiments.
  • Reviving Brand:
    One of the best uses of this data is that it allows organizations to quantify perceptions – about their brand, products and services, marketing campaigns, social engagement initiatives, online content etc. Organizations can use this information for devising better and more effective branding and marketing strategies and thus improve your brand reputation.
  • Beats Competition:
    This data lets the organizations to know sentiments surrounding their competitors too. This allows to benchmark their performance against that of their competitors.
  •  Measure Effectiveness of Marketing Campaigns:
    Analyze changes in sentiment relative to specific campaigns, audiences and social outlets, and can quickly identify positive talking points around the brand to measure, inform and evaluate marketing strategy.

Configuring Flume with Twitter App

Flume needs agents that connect to data sources to work. Agents are written in Java–and you could write your own agent. Luckily for us, Cloudera provides a sample Twitter agent for Flume that we’ll use in this tutorial. Although shared by Cloudera, it will work with other Hadoop distributions as well.

Copy the .jar file to the /usr/lib/flume/lib folder on the node where you installed the Flume software.
Now that the agent code is in place, we need to configure flume to create an agent using the class in that .jar. We do this by updating the /etc/flume/conf/flume.conf file.

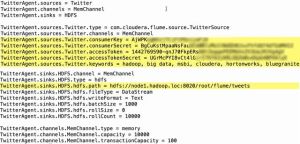
Then make the following changes. Note that the configuration file uses the term “consumerKey” and “consumerSecret“. Twitter now calls these “API Key” and “API Secret“, respectively. Simply substitute in the keys from the Twitter app.
The TwitterAgent.sources.Twitter.keywords contains a comma-separated list of words used to select which tweets needed to be added to HDFS.
The TwitterAgent.sinks.HDFS.hdfs.path provides the path from the name node where the tweets should be saved. Be sure that the user running the Flume agent can write to this HDFS file location.

w640 (5)

Now that the configuration is complete, start the flume agent. Since the agent needs to be continue running even after closing ssh session, start the process using NOHUP:

nohup flume-ng agent –conf-file /etc/flume/conf/flume.conf –name TwitterAgent >flume_twitteragent.log &

As the agent begins running, monitor its progress by using the tail command against the log file (specified on the previous command line) with the “follow” flag:

tail -f flume_twitteragent.log

And of course the “acid test” is to look at the files being collected in HDFS:

hadoop fs -ls /root/flume/tweets

w640 (6)

Installing Flume on HDP

The next step is to install Flume on the Hadoop cluster node you’ll use as the flume agent. Pick a node that has a client role, as the agent will be connecting with the name node, and sending files to HDFS nodes as data is streamed.
Flume is easy to install with HDP. Just run the following two Yum commands as root (or use sudo if not logged in as root):

yum install flume
yum install flume-node

After these two commands are complete, the Flume code is installed and ready to be used.

Creating a Twitter Application

  • You probably already have a twitter account. If you don’t, create one on Twitter.com.
  • Next, browse to dev.twitter.com, login with your Twitter ID, and read through some of the introductory API material on Twitter Apps. A “Twitter App” can take many forms. Any piece of software that interacts with twitter on behalf of a user is an app.A mobile phone app you can write as an alternative to the one Twitter provides is a “Twitter App”.  The Flume agent we’ll create is an “App” too.
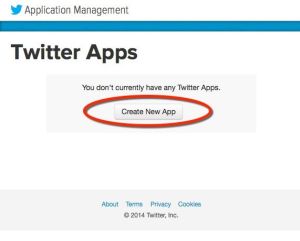
  • Next browse to apps.twitter.com, and click the Create New App button.

w640

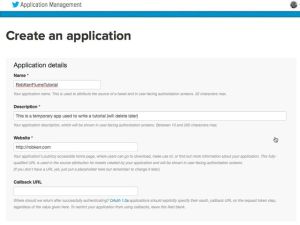
  • Next fill in the basic app info form. The application “Name” must be globally unique across all Twitter apps for all users, so pick something unique.  After filling the info, agree to the terms of use and press the “Create App” at the bottom of the form.

w640 (1)

You’ll be redirected to the management page for your new app. Switch to the API Keys tab, and click the create my access token button.

OK, you’re done!  There are four pieces of information you need to copy from the form before we go to the Hadoop cluster to setup the Flume agent:

  1. API key
  2. API secret
  3. Access token
  4. Access token secret

These four keys will be added to a configuration file in Flume, enabling it to use your Twitter account to stream tweets. Copy the four into a text file for later reference.

w640 (2)

w640 (4)

Installing Hortonworks Sandbox 2.0 – VirtualBox on Windows

Prerequisites

To use the Hortonworks Sandbox on Windows you must have the followingresources available to you:

  • Hosts:
    A 64-bit machine with a chip that supports virtualization.
    A BIOS that has been set to enable virtualization support.
  • Host Operating Systems:
    Windows 7, 8
  • Supported Browsers:
    Internet Explorer 9
    Note, The Sandbox will not work with Internet Explorer 10
    Firefox – latest stable release
    Google Chrome – latest stable release
  • At least 4 GB of RAM
    8 GB of RAM for Ambari or Hbase
  • Virtual Machine Environments:
    Oracle VirtualBox, version 4.2 or later

Virtual Machine Overview
The Hortonworks Sandbox is delivered as a virtual appliance that is a bundled set of operating system, configuration settings, and applications that worktogether as a unit.

Installing on Windows using Oracle VirtualBox
1. Open the Oracle VM VirtualBox Manager

2. The Oracle VM Virtualization Manager window opens.

3. Change the Auto-Capture preference. File->Preferences and select Input in the left navigation bar. Uncheck Auto-Capture Keyboard.

4. Import the Sandbox appliance file: File->Import Appliance, the Import Virtual Appliance screen opens.

5. Click the Open appliance button; the file browser opens. Make sure you select the correct appliance. In this case, the top file is the VirtualBox formatted file. Click the Open button.

6. The Appliance settings screen appears. The default settings work. If you have more than 4 GB of physical RAM installed, you may wish to allocate more RAM to the VM – 4GB of RAM in the Virtual Appliance will improve the performance. Click Import.

7. The appliance is imported.

8. Turn on the Sandbox. Select the appliance and click the green Start arrow. A console window opens and displays an information screen. Click OK to clear the info screen.

9. Wait while the VM boots up. When the process is complete, the console displays the login instructions for the Sandbox.

10. Use a browser on your host machine to open the URL displayed on the console.

Using Spring XD to stream Tweets to Hadoop

1 – Download and Install Spring-XD

Spring-XD can be found at http://spring.io. This tutorial uses the 1.0.0.M3 version, so conventions may change in next release. Follow the install instructions and kick up Spring-XD with a test stream to make sure it’s looking good.

create stream --name ticktock --definition "Time | Log"

That simple instruction should begin showing output in the server terminal window similar to:

2013-10-12 17:18:09
2013-10-12 17:18:10
2013-10-12 17:18:11
2013-10-12 17:18:12
2013-10-12 17:18:13
2013-10-12 17:18:14

Congrats, Spring-XD is running.

2 – Download and Install Hadoop

The hadoop can be installed on the singlenode by using the steps mentioned in my previous blog at https://amankumarlabra.wordpress.com/2014/08/09/installing-single-node-hadoop-2-4-1-on-ubuntu/

Configuring Spring-XD to use Hadoop :

Step 1 – Edit the Hadoop.properties file Edit the file at XD_HOME\xd\config\hadoop.properties to enter the namenode config:

fs.default.name=hdfs://10.0.0.27:8020

Step 2 – Spin up the Spring-XD Service with Hadoop

In a terminal window get the server running from the XD_HOME\XD\ folder:

./xd-singlenode --hadoopDistro hadoop24

Step 3 – Spin up the Spring-XD Client with Hadoop

In a separate terminal window get the shell running from the XD_HOME\Shell\ folder:

./xd-shell --hadoopDistro hadoop24

Then set the namenode for the client using the IP Address of the hadoop:

hadoop config fs --namenode hdfs://10.0.0.27:8020

Next, test out whether you can see HDFS with a command like:

hadoop fs ls /

You should see something like:

drwxr-xr-x   - hdfs   hdfs          0 2013-05-30 10:34 /apps
drwx------   - mapred hdfs          0 2013-10-12 17:06 /mapred
drwxrwxrwx   - hdfs   hdfs          0 2013-10-12 17:19 /tmp
drwxr-xr-x   - hdfs   hdfs          0 2013-06-10 14:39 /user

Once that’s confirmed we can set up a simple test stream. In this case, we can re-create TickTock but store it in HDFS.

stream create --name ticktockhdfs --definition "Time | HDFS"

Leave it a few seconds, then destroy or undeploy the stream.

stream destroy --name ticktockhdfs

You can then view the small file that will have been generated in HDFS.

hadoop fs ls /xd/ticktockhdfs

Found 1 items
-rwxr-xr-x   3 root hdfs        420 2013-10-12 17:18 /xd/ticktockhdfs/ticktockhdfs-0.log

Which you can quickly examine with:

hadoop fs cat /xd/ticktockhdfs/ticktockhdfs-0.log

2013-10-12 17:18:09
2013-10-12 17:18:10
2013-10-12 17:18:11
2013-10-12 17:18:12
2013-10-12 17:18:13
2013-10-12 17:18:14

Cool, but not so interesting, so let’s get to Twitter.

3 – Create the Tweet Stream in Spring-XD

In order to stream in information from Twitter, then you’ll need to set-up a Twitter Developer app so you can get the necessary keys. Once you have the keys, you can add them to XD_HOME\xd\config\twitter.properties In our case, we’ll take a look at the stream of current opinion on that current icon of popular culture: Miley Cyrus. The stream can be set-up as follows with some simple tracking terms:

stream create --name cyrustweets --definition "twitterstream --track='mileycyrus, miley cyrus' | hdfs"

You might want to build up these files for a little while. You can check in on the data at:

hadoop fs ls  /xd/cyrustweets/

Found 12 items
-rwxr-xr-x   3 root hdfs    1002252 2013-10-12 19:33 /xd/cyrustweets/cyrustweets-0.log
-rwxr-xr-x   3 root hdfs    1000126 2013-10-12 19:33 /xd/cyrustweets/cyrustweets-1.log
-rwxr-xr-x   3 root hdfs    1004800 2013-10-12 19:34 /xd/cyrustweets/cyrustweets-10.log
-rwxr-xr-x   3 root hdfs          0 2013-10-12 19:34 /xd/cyrustweets/cyrustweets-11.log
-rwxr-xr-x   3 root hdfs    1003357 2013-10-12 19:33 /xd/cyrustweets/cyrustweets-2.log
-rwxr-xr-x   3 root hdfs    1000903 2013-10-12 19:33 /xd/cyrustweets/cyrustweets-3.log
-rwxr-xr-x   3 root hdfs    1000096 2013-10-12 19:34 /xd/cyrustweets/cyrustweets-4.log
-rwxr-xr-x   3 root hdfs    1001072 2013-10-12 19:34 /xd/cyrustweets/cyrustweets-5.log
-rwxr-xr-x   3 root hdfs    1001226 2013-10-12 19:34 /xd/cyrustweets/cyrustweets-6.log
-rwxr-xr-x   3 root hdfs    1000398 2013-10-12 19:34 /xd/cyrustweets/cyrustweets-7.log
-rwxr-xr-x   3 root hdfs    1001404 2013-10-12 19:34 /xd/cyrustweets/cyrustweets-8.log
-rwxr-xr-x   3 root hdfs    1006052 2013-10-12 19:34 /xd/cyrustweets/cyrustweets-9.log

The default rollover for the logs is 1MB so there are a lot of files. You might want to increase that or change other options. After a cup of coffee or two, we should have some reasonable data to begin processing and refining. It took around 30 mins to generate 100MB of log files – clearly a fairly popular topic. At this point, you can undeploy the stream so we can do some sample analysis:

stream undeploy --name cyrustweets

How to Stream Twitter Data With HDP and Flume

Introduction

One of the most referenced use cases for Hadoop is to collect social media interactions to better understand consumer sentiment about a topic, brand or company.  Hadoop is an ideal platform for this, since it can inexpensively store large volumes of data, and is especially good at analyzing data whose structure isn’t understood in advance.

However, streaming data from social media sources is easier said than done, and it’s easy to be discouraged.  After reading this tutorial, you should be able to repeat the process for yourself confidently!

In this tutorial I’ll show step-by-step how to use HortonWorks HDP 2.1 Hadoop distribution (on Linux), and Apache Flume to collect Twitter Tweets and store them in HDFS for later analysis. If you’re using a different Hadoop distribution, or using Windows instead of Linux, this process will be nearly the same for you.  However, some of the commands and file locations may be slightly different and require adjustments.

Prerequisites

Before beginning, make sure you have a HortonWorks cluster installed, and your HDFS file system is operational.  In addition, the node in the cluster that you’ll use for collecting tweets should have access to the Internet (obviously).

I’m using is a HDP 2.1 sandbox running on the CentOS 6.5 distribution of Linux.  I’ll be installing and configuring Flume on localhost, which is one of my data nodes that has the Hadoop client role deployed to it.

Creating a Twitter Application

You probably already have a twitter account.  If you don’t, create one on Twitter.com.

Next, browse to dev.twitter.com, login with your Twitter ID, and read through some of the introductory API material on Twitter Apps.  A “Twitter App” can take many forms. Any piece of software that interacts with twitter on behalf of a user is an app. A mobile phone app you an write as an alternative to the one Twitter provides is a “Twitter App”.  The Flume agent we’ll create is an “App” too.

Next browse to apps.twitter.com, and click the Create New App button.

Next fill in the basic app info form.  The application “Name” must be globally unique across all Twitter apps for all users, so pick something unique.  After filling the info, agree to the terms of use and press the “Create App” at the bottom of the form.

You’ll be redirected to the management page for your new app.  Switch to the API Keys tab, and click the create my access token button.

2014-07-03_13-40-07

OK, you’re done!  There are four pieces of information you need to copy from the form before we go to the Hadoop cluster to setup the Flume agent:

  1. API key
  2. API secret
  3. Access token
  4. Access token secret

These four keys will be added to a configuration file in Flume, enabling it to use your Twitter account to stream tweets.  Copy the four into a text file for later reference.

2014-07-03_13-42-41

2014-07-03_13-44-30

Installing Flume

The next step is to install Flume on the Hadoop cluster node you’ll use as the flume agent.  Pick a node that has a client role, as the agent will be connecting with the name node, and sending files to HDFS nodes as data is streamed.

Flume is easy to install with HDP.  Just run the following two Yum commands as root (or use sudo if not logged in as root):

yum install flume

After these two commands are complete, the Flume code is installed and ready to be used.  But Flume needs agents that connect to data sources to work.  Agents are written in Java–and you could write your own agent.  Luckily for us, Cloudera provides a sample Twitter agent for Flume that we’ll use in this tutorial.  Although shared by Cloudera, it will work with other Hadoop distributions as well.

Download the Cloudera .jar from this link: http://files.cloudera.com/samples/flume-sources-1.0-SNAPSHOT.jar

Copy the .jar file to the /usr/lib/flume/lib folder on the node where you installed the Flume software.

Now that the agent code is in place, we need to configure flume to create an agent using the class in that .jar.  We do this by updating the /etc/flume/conf/flume.conf file.

Download the sample flume.conf file cloudera included on github as a base here:

https://github.com/cloudera/cdh-twitter-example/blob/master/flume-sources/flume.conf

Then make the following changes (highlighted in yellow).   Note that the configuration file uses the term “consumerKey” and “consumerSecret“.  Twitter now calls these “API Key” and “API Secret“, respectively. Simply substitute in the keys you copied from the Twitter app configuration screen earlier.

The TwitterAgent.sources.Twitter.keywords contains a comma-separated list of words used to select which tweets you want to add to HDFS.

The TwitterAgent.sinks.HDFS.hdfs.path provides the path from the name node where the tweets should be saved.  Be sure that the user running the Flume agent can write to this HDFS file location.  Note in this tutorial I used the “root” user to run the agent.  In a production solution, it would be better to create a specific user for the agent to use, and and assign that user only the permission it needs.  But, for learning purposes in a lab environment, it’s OK to use root.

2014-07-03_14-13-03

Now that the configuration is complete, we can start the flume agent.  Since we want the agent to continue running even when we close our ssh session, start the process using NOHUP:

nohup flume-ng agent --conf-file /etc/flume/conf/flume.conf --name TwitterAgent >flume_twitteragent.log &

As the agent begins running, you can monitor progress by using the tail command against the log file (specified on the previous command line) with the “follow” flag:

tail -f flume_twitteragent.log

And of course the “acid test” is to look at the files being collected in HDFS:

hadoop fs -ls /root/flume/tweets

2014-07-03_15-10-19